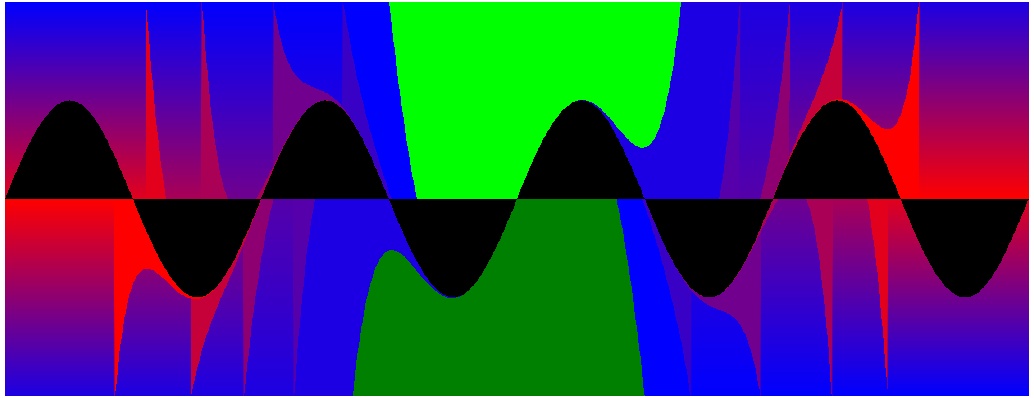
Taylor Series for Sin
This graphic was produced with Maple version 10 Software. It is a graph of sin(x) and a set of partial Taylor series for sin(x).
The Art
Construction of This Art
> restart;
> p := proc (n) options operator, arrow; convert(series(sin(x), x = 0, 2*n+4), polynom) end proc;
> cfun := proc (k) options operator, arrow; COLOR(RGB, 1.0-k/(count-1), 0., 0.+k/(count-1)) end proc;
> count := 10;
> plot([2, -2, `$`('p(k)', k = 0 .. count-1), sin(x)],
> x = -4*Pi .. 4*Pi,
> y = -2 .. 2,
> numpoints = 800,
> color = [COLOR(RGB, 0, 1, 0), COLOR(RGB, 0, .5, 0), `$`(cfun(k), k = 0 .. count-1), black],
> filled=true,
> axes=none);